Showing posts with label Unemployment data. Show all posts

Saturday, September 16, 2006

Unemployment Data - April 2009

[This table is taken from Chris Martenson's blog post below. Blogger is giving me a few issues.]

If you are one of many people who believe we are somehow reaching a bottom to this ‘recession’ because of the recent release of April unemployment data – you need to take a closer look. Chris Martenson has – once again – dissected the actual data and it shouldn’t surprise anyone that our government and the media continue to ‘spin’ the data to make it look much more positive.

From the article in Chris’ post below:

“April's loss of 539,000 jobs was the smallest decline since October's 380,000”

539,000 is a very big number – but is it an accurate indication of what is really happening? No. If we remove the ridiculous birth/death adjustment (+226,000 jobs out of thin air) – we see that our economy actually lost 765,000 jobs in April – far worse than reported – and we see that the trend continues to show that our economy is deteriorating. Nothing within the actual economic data I see suggests a ‘turnaround’.

I recommend that you watch Chris’ video below if you want a better understanding of how our government manipulates economic data. Not surprisingly, their recent manipulations tend to lead to more positive results.


jg – May 11, 2009

____________________________

From ChrisMartenson.com:

Thank you, Erik (and others!), for the support and the idea to publicize. I think I will send out a short message and link to it by newsletter AND do a blog post.

Meanwhile, I am finding myself quite amused by the payroll numbers released this morning at 8:30:

Payrolls drop by 539,000; jobless rate jumps to 8.9%
By Rex Nutting, MarketWatch

Last update: 8:36 a.m. EDT May 8, 2009

WASHINGTON (MarketWatch) - The U.S. economy continued to shred jobs at a horrendous pace in April, with nonfarm payrolls falling by 539,000 and the unemployment rate jumping to a 26-year high of 8.9%, the Department of Labor reported Friday.

The report was largely as expected, reflecting an easing in the pace of massive job destruction from the previous five months. Since the recession began in December 2007, payrolls have fallen by 5.7 million, or 4.1% of payrolls, the largest percentage decline since the 1958 recession.
April's loss of 539,000 jobs was the smallest decline since October's 380,000. Job losses in February and March were revised higher by 66,000.

The article goes on in great depth to parse out the numbers, but mysteriously makes no mention of the the birth-death model, the most important number of them all.
Here it is:
[see table at top of blog post]

Wow! The government's model managed to crank out 226,000 additional "thin-air" jobs to add back into the mix. For the record, this is 50,000 MORE jobs than were added by the model last April.

What sort of a model do they have that assesses the current hiring conditions to be 30% better than last year? What model could possibly be adding construction and finance jobs at this time? What do they use for inputs? How come these modelers still have jobs?

At any rate, if the B-D model had not added the 226,000 jobs, the report would have come in at -765,000, which is FAR worse than expected.

Really, this is just getting silly at this point. The US government is losing all credibility at a quite rapid pace, and more and more people are catching on. But in all seriousness, I fear the backlash that could result from the populace when the collective weight of all these insults to our intelligence finally boil over into some sort of a response.

Unemployment Data - June 2009

The info/analysis at the bottom of this email is from John Williams (Shadowstats.com). He re-creates Government economic data in the same way it was reported in the past – before the Government decided to make significant changes to how economic data is collected and reported.

If you're not familiar with the birth/death model - it's a model that either adds or removes jobs to 'official' Government unemployment stats (it has nothing to do with the birth/death of people). The thinking behind this model is that the Government cannot account for new businesses or businesses that shut down - quickly enough in a given month - so instead of simply reporting the actual data (ADP employment report, etc.) each month - the Government 'estimates' how many new businesses started or businesses that closed in a given month with the corresponding addition or subtraction of jobs associated with those businesses. If you think this sounds like a very inaccurate way to track unemployment - you'd be right. No one really knows how this model works - it's a mystery.

You'll also notice that this model is never mentioned when unemployment data is released each month. Wonder why? The stock market dropped 200 points today because job losses were 'worse than expected' at 467,000 lost jobs in June. Imagine what would happen if the real number of 700,000 was released. Since February 2009 - the birth/death model has added 879,000 jobs to government unemployment data during one of the worst recessions in our history. It appears that someone is trying to make things look much better than reality.

Here’s a summary of June's umeployment report:

1. The Government’s ‘birth/death’ model added 185,000 jobs to the June unemployment report. Note the industries where many of the jobs were added – and ask yourself if this makes any sense.
• 31,000 jobs were added in Construction
• 21,000 jobs were added in Trade/Transportation
• 25,000 jobs were added in Business/Services
• 87,000 jobs were added in Leisure/Hospitality
• 7,000 jobs were added in Manufacturing

2. If we disregard the birth/death model – almost 700,000 jobs were lost in June (consistent with previous months)

3. Annual payroll decline is now the worst since 1958.

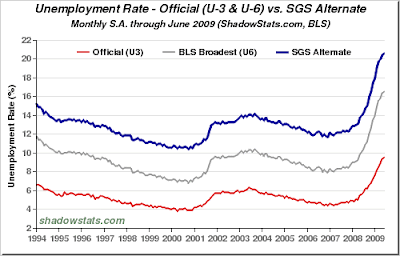
4. Actual unemployment rate is 21% (if we consider all of the people who are looking for work – the government selectively removes ‘discouraged’ workers)

jg – July 2, 2009
_____________________________

- June Jobs Loss Was 513,000 Net of Concurrent Seasonal Factor Bias
Likely Topped 700,000 with Birth-Death Machinations

- Payroll Employment Growth Overstatement
Could Top 2.5 Million Per Year with Birth-Death Modeling

- Annual Payroll Decline Deepened to 4.2%
Equal to 1958 Trough and Near 1949 Trough

- SGS-Alternate Unemployment at 20.6%

"June Employment Reporting Showed Ongoing Economic Deterioration. The Bureau of Labor Statistics (BLS) released ongoing indications of deteriorating U.S. employment/unemployment conditions in June, with a worse-than-expected 467,000 drop in June payrolls, but a narrower-than-expected rise in unemployment to 9.5%. Net of the Concurrent Seasonal Factor Bias (discussed below) and net of distortions built into the reporting by the Birth-Death Model (discussed below), the June jobs loss likely exceeded 700,000.

"The severe recession continues to deepen. My broad outlook has not changed; the worst of the financial and economic crises remain ahead of us. Before getting into the detail of the June report, a variety of special considerations are detailed, as directly related to the reporting of employment conditions as well as to broader implications for economic reporting in general."


Best regards,

The ShadowStats Team
(shadowstats.com)

2nd Quarter 2009 Earnings - Profit Surprises or Revenue Declines?

The stock market has risen over the past week as many company’s 2nd quarter earnings beat Wall Street ‘expectations’. I mentioned in a previous post that although many companies are beating lowered Wall Street expectations – this is not an indication of ‘green shoots’ or that the economy is somehow stabilizing.

In this economic environment where sales and revenue are declining significantly, most companies are trimming costs wherever possible – headcount, travel, inventories, etc. to offset the reduction in revenue. This, in turn, reduces expenses and obviously helps their profit/earnings. Any good manager must do this – you can’t survive if your expenditures don’t line-up with your volume of sales – management 101 stuff. So, we see that many companies have reduced expenses and have managed to beat their earnings expectations. This, in turn, has led the stock market higher.

If we want to look at our economy from a high level (macro-economic level) and determine if things are actually turning around – the best way to do this is to look at the top line revenue of some of our biggest companies – and ignore what they’re doing to offset any reduction in sales/revenue. In an economy based on exponential growth, sales/revenue growth is essential for the system to continue to function.

Let’s start by looking at UPS and FedEx’s recent quarterly results (June/July 2009). Many economists/analysts look at these companies because of the large volume of goods they transport. It stands to reason that if the economy is in good shape or stabilizing – package volume will increase or – at a minimum – remain in line with previous quarters.

“United Parcel Service Inc.'s second-quarter income fell 49% on continued weak demand, with the shipping bellwether warning that conditions have yet to improve substantially and forecasting discouraging third-quarter results.

Revenue decreased 17% to $10.83 billion. Operating margin fell to 8.3% from 11.2%, while average revenue per package fell 11%.

U.S. package revenue fell 12%, while international package segment revenue dropped 24%. In a post-earnings conference call, Mr. Kuehn said the "stagnant economic activity around the world negatively impacted all of our business segments" in the second quarter. He added that the company is bracing for more of the same until it sees clear indications of improvement.

As a diversified transportation company that moves everything from documents to building materials, UPS, along with rival FedEx, is considered a barometer for the state of the U.S. economy.”

We see UPS package revenue/volume falling 12-24% - and the forecast is for more of the same for the remainder of 2009. It doesn’t take an economics professor to see that one of the barometers for the current state of the U.S. economy – is not good.

“For the fiscal year ended May 31, [FedEx] the Memphis, Tenn.-based shipping company, and Atlanta-based United Parcel Service Inc.'s chief rival, posted net income of $98 million, or 31 cents per share. That compares to net income of $1.12 billion, or $3.60 per share, for full-year 2008. Revenue fell 20 percent to $7.85 billion” (June 2009)

Federal Express has a similar story as UPS – volume/revenue down - in the 20% range. Two very big barometers of our economy are telling us that things are not improving.

Let’s move on and take a look at some other large company’s recent earnings reports. Take note of the their sales and revenue declines.

AT&T Inc.'s second-quarter profit fell 15% on continuing weakness in the landline business despite continued growth in wireless data revenue and subscriber totals. Revenue slipped 0.4% to $30.73 billion. Profit from the wireline segment fell 6.1% on a 36% drop in revenues.

McDonald's second-quarter profit came in at $1.09 billion or 98 cents a share, including a one cent benefit from an asset sale, down from $1.19 billion, or 1.04 a share, a year earlier. Revenue decreased 7% to $5.65 billion.

3M Co.'s second-quarter earnings fell 17% as weak demand pushed sales lower. The company's results, however, still beat Wall Street expectations. The diversified manufacturer has cut costs but still faces significant declines in manufacturing and transportation markets. In early April 3M offered early retirement to 3,600 nonunion employees, or about 11% of its U.S. work force. It cut 1,200 workers in the first quarter. In the latest quarter, the company reported earnings of $783 million, or $1.12 a share, compared with $945 million, or $1.33 a share, a year earlier. Excluding items such as restructuring-related expenses, earnings came to $1.20 a share from $1.39 a share a year earlier. Net sales fell 15% to $5.7 billion.

On a regional basis, Ford North America narrowed its pre-tax loss to $851 million from a loss of $1.3 billion a year earlier while Ford Europe -- traditionally its strongest segment -- saw its pre-tax profit shrink to $138 million from $582 million a year earlier. Last quarter, the North America unit reported an operating loss of $637 million while Europe had a $550 million loss. Excluding items, the company's loss came to 21 cents a share, which was narrower than the 50 cent average loss estimate of analysts surveyed by Thomson Financial. Revenue dropped to $27.2 billion, compared to $38.6 billion for the same time period a year earlier (decline of 29.5%).

Halliburton, the world's second-largest oilfield-services company by revenue after Schlumberger Ltd., reported profit of $262 million, down 48% from a year earlier, though stronger than analysts had expected. Revenue fell 22% to $3.5 billion.

General Electric Co. said second-quarter net income fell 49% as the recession took a toll on both its industrial businesses and its struggling finance unit. Profit at the finance division, GE Capital, fell 80% to $590 million because of rising loan losses and a 29% decline in revenue. Without a $678 million tax benefit, the unit would have lost money. In its industrial units, GE said orders for equipment fell 42%.

Mattel Inc. reported an 82% jump in second-quarter earnings as cost cutting offset worse-than-expected sales that reflected consumers' diminished spending and retailers' efforts to curb inventories. The world's largest toy maker reported a profit of $21.5 million, or six cents a share, up from $11.8 million, or three cents a share, a year earlier. Revenue fell 19% to $898.2 million.

International Business Machines Corp.'s second-quarter profit rose 12% as the company continued to hone its operations, but sales fell and the technology giant offered few signs businesses are prepared to resume spending. But weakness in the Armonk, N.Y., giant's short-term consulting business and a 26% decline in hardware revenue compared with a year ago indicate that the technology business overall still faces stiff challenges. IBM is faring better than some other technology vendors because it exited the PC business and now focuses on computer services, software and hardware for businesses and governments. In the second quarter, IBM had a profit of $3.1 billion, or $2.32 a share, up from $2.77 billion, or $1.97 a share. Revenue fell 13% to $23.25 billion from $26.82 billion.

Google Inc.'s growth continued to slow in the second quarter, signaling the online ad market remains in a slump. The Internet search giant's revenue inched up 2.9% from a year earlier to $5.52 billion, down from 6% growth in the first quarter, and far below the 39% growth Google saw in the second quarter last year. The results suggest there won't be a rebound anytime soon for the $24.5 billion U.S. Internet advertising market, of which Google commands roughly a third of the market share.

Nokia's net profit for the three months ended June 30 totaled €380 million ($537 million), down 66% from a year earlier, but ahead of analysts' expectations for €316 million. Sales fell 25% to €9.91 billion.

In the second quarter, EMC's earnings fell to $205.2 million, or 10 cents a share, from $360.1 million, or 17 cents a share, a year earlier. Revenue dropped 11% to $3.26 billion.

Southwest Airlines Co. returned to a profit after three straight quarterly losses but painted a bearish picture for the remainder of the year as two major competitors also highlighted continuing difficulties for the industry. Echoing comments by executives at UAL Corp.'s United Airlines and Continental Airlines Inc., which also announced second-quarter financial results on Tuesday, Southwest Chief Executive Gary Kelly said management is bracing for "continued weakness." Despite signs of stronger demand in July, he added, the carrier "can't confidently predict" another profit in the third quarter. "I don't think the worst is behind us," Mr. Kelly said during a conference call. "I think the worst is ahead." After cutting its fleet of almost 550 aircraft by as many as 15 planes by the end of the year, the airline's capacity will have dropped by as much as 6% in 2009.

John Tague, UAL's chief operating officer, said United expects its overall capacity in the second half of this year to be down 12% and is prepared to trim more, if necessary. After Labor Day, as a response to the dramatic decline in international travel demand, the airline intends to cut international seats by another 7%, after a 7.7% reduction in the second quarter.

Continental, the fourth-largest U.S. airline, said its quarterly loss widened to $213 million, or $1.72 a share, compared with a loss of $5 million, or five cents a share, a year earlier. In addition to plunging demand for business travel, the airline's earnings were battered by fears related to the H1N1 virus. Excluding charges of $44 million, the airline posted a loss of $169 million, or $1.36 a share.

American Airlines parent AMR Corp. on Wednesday reported a $390 million second-quarter loss as collapsing travel demand continued to erase gains from lower fuel costs. The results are the latest evidence that the airline industry is flying through one of its toughest summers ever. "We expect a tough ongoing revenue environment," said AMR finance chief Tom Horton in a conference call. AMR, of Fort Worth, Texas, said second-quarter revenue fell 21% to $4.89 billion from a year earlier. Average fares fell 15%, even as the No.2 U.S. airline by traffic cut its capacity by 7.6% from the year-ago quarter as leisure and business travelers stayed home.

Microsoft Corp. said Thursday its profit in the last quarter plunged 29% because of weak computer sales, ending a fiscal year in which the software maker's revenue fell for the first time since the company went public in 1986. "Our businesses continued to be negatively impacted by weakness in the global PC and server markets," said Chief Financial Officer Chris Liddell. For the quarter ended June 30, the company reported earnings of $3.05 billion, or 34 cents a share, down from $4.3 billion, or 46 cents a share, a year earlier. Revenue decreased 17% to $13.1 billion.

American Express Co. second-quarter earnings fell 48% amid its preferred-stock repurchase as the credit-card issuer set aside less money for bad accounts amid falling customer balances. Like all financial companies, American Express has suffered in the economic downturn. After it posted its first-quarter results in April, both Moody's and S&P downgraded American Express, citing worries about poor revenue trends, weak asset quality and long-term liquidity. Revenue, net of interest expense, decreased 18% to $6.09 billion.

Xerox said net income for the quarter fell 35% to $140 million, or 16 cents a share, from $215 million, or 24 cents a share, a year earlier. Revenue declined 18% to $3.73 billion. The revenue decline was led by a 29% drop in equipment sales.

Fortune Brands's home and hardware segment sells products such as Moen faucets and Kitchen Craft cabinetry. The business -- which provides about 45% of the company's revenue -- has been hit hard by the U.S. housing slump. Sales in the home and hardware segment dropped 25% though the unit swung to a profit, as expected, due to lowered costs and other restructuring moves by the Deerfield, Ill., company.

Another big player in the home-products business, Black & Decker Corp., said its second-quarter profit plunged 60% amid a continuing sales slump, though core earnings beat analyst expectations. Sales of power tools and accessories, by far its largest segment, fell 21%.

If we disregard all of the spin and ignore optimistic ‘forecasts’ that have no quantitative basis – I’m not sure how anyone can say that our economy is ‘stabilizing’ or that ‘green shoots’ are appearing. If you want to determine if the economy is stabilizing - simply looking at profits isn't going to help you because of the massive expense reductions companies are implementing due to plunging sales and revenues. While reducing expenses will certainly help the bottom line - they contribute to our continued economic decline. You must look at sales and revenues and determine if business is increasing - to determine if the economy is really turning a corner. If we continue to see significant revenue declines and continued expense reductions from public companies - you'll know that the economy continues to deteriorate.

But - as the mainstream media spin machine marches on - we see headlines like this in the Wall Street Journal (July 24th, 2009):

"Stocks Recapture 9000 on Profit Surprise"

It's not hard to beat 'expectations' when you continue to lower the bar.

What we should see is a headline like this:

"Revenue Declines Signal a Deepening Recession"

I understand why all of these companies are reducing expenses in this environment of declining revenues, but it’s clear that these efforts are causing our unemployment rate to increase dramatically – to a much greater degree than is widely known.


The blue line above shows the U.S. unemployment rate according to how it was calculated in the 1980’s (before the government made changes to the calculation to show more favorable unemployment rates). As you can see, if we add in all of the people who have given up looking for work (discouraged workers) and all of the people who have taken part time jobs because they can’t find a permanent job – the actual unemployment rate is approximately 21%.

If revenues are declining across many different industries throughout the world and this is causing a significant spike in unemployment, I’m not sure why anyone would feel confident that the recession is ending.

We’ve all been conditioned to focus on Wall St. earnings ‘expectations’ and we’re not looking at the bigger picture – that sales and revenues are declining by significant percentages across the entire system. What happens when sales and revenue continue to decline and companies have nothing left to cut from expenses? Eventually, your business model collapses and your business fails.

As we’ve learned – it’s not just corporate revenue that is giving us clues to what is happening. Government tax revenues (local, state federal), housing sales/prices, unemployment, individual/corporate/government debt, retail sales – things that are quantifiable – tell us the true nature of our economy.

What we are seeing is the continuing collapse of a debt-based monetary system. All of the Federal Reserve and Government ‘stimulus’ packages will only delay the inevitable end of this system.

jg – July 25, 2009
______________________

Update - July 31, 2009

A few days after writing the post above, Chris Martenson added some corporate revenue information (analysis) on his blog. This isn't rocket science - it's not hard to tell good data from bad - once you have a basic understanding of what can be manipulated easily.

Here's a brief excerpt from Dr. Martenson's blog post:

Also, into the "good" bucket I have now included corporate revenues because, unlike a corporate earnings statement (now in the murky bucket), there are many fewer games and shenanigans that can be played with revenue. Apart from sliding revenue forwards and backwards a quarter or two, it is relatively pure data. GAAP accounting assures as much.

Added up across all companies, revenue provides a nice, clean picture of where things are going. Perhaps the best we have.

Here's the most recent picture of that (found here) :


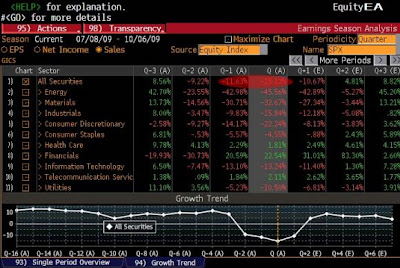
What we see here is that for ALL companies in the S&P 500, a comprehensive enough sample that we can use this as a reliable measure of revenue across the entire corporate landscape, we find that revenues are down more than -15% in Q2 2009 compared to 2Q 2008.

Now, if you think about it, when people buy (or consume) anything, that transaction passes through a company somewhere, somehow. So we might use this -15% decline in corporate revenue as a pretty good approximation for how much less stuff is being consumed this year compared to last year.

________________________________

Update - August 19, 2009

Chris Martenson added another blog post a couple of days ago relating to revenue declines and the games corporations are playing with earnings.

Target and Home Depot - "Beat by a Penny!"

Tuesday, August 18, 2009, 11:13 am, by cmartenson (Chris Martenson)

The gaming of our economic system and statistics is not the sole province of the government. Corporations have mastered the art as well.

Naturally, this is not much of a surprise, because with the government setting the tone for providing perpetually "better than expected" economic statistics, it stands to follow that corporations and Wall Street will gladly follow along.

Here are two separate examples from today to illustrate how the game is played. The game, for any new readers here, involves Wall Street analysts providing super-lowball estimates of earnings that a company can easily beat, and then trumpeting that result while conveniently glossing over the sordid details involving any worse-than-expected revenue shortfalls or accounting tricks used by the company to boost their earnings.

The first concerns the giant retailer Target (TGT), which announced their quarterly earnings this morning:

Target Second-Quarter Profit Tops Analysts’ Estimates (Correct)

Aug. 18 (Bloomberg) -- Target Corp., the second-largest U.S. discount retailer, reported second-quarter profit that fell less than analysts estimated. The shares rose in early U.S. trading.

Net income declined to $594 million, or 79 cents a share, from $634 million, or 82 cents a share, a year earlier, Minneapolis-based Target said today in a Business Wire statement. Analysts estimated profit excluding some items of 66 cents, the average in a Bloomberg survey. The retailer said July 9 it would meet or exceed a median estimate of 64 cents.

Target said at the time that its gross margin, the revenue remaining after deducting the cost of goods sold, was better than expected and its credit-card group benefited from a modest improvement in risk trends. Sales in the retail unit declined 2.7 percent to $14.6 billion in the quarter ended Aug. 1.

“Despite continued pressure on discretionary items, Target continues to manage its inventories well, and gross margin has held up quite well year-to-date,” Robert Drbul, an analyst at Barclays Capital, wrote in an Aug. 11 report.

That all sounds great; TGT beat estimates every which way, and it's gross margin is holding up.

Look at the impact on the stock price - that's a hefty pop (and that was the goal of the game):


But, wait a minute. What about revenues? Revenue is the driver of everything. And did TGT do anything unusual in its accounting to achieve these "better than expected" earnings? The article doesn't say.

Digging a bit further into the financial reporting universe, we find this information:

[Target's] total revenue fell 2.6% to $15.07 billion. The company said earlier this month same-store sales fell 6.2%. Analysts polled by Thomson Reuters expected revenue of $15.15 billion.

The credit-card segment's profits slid 15% on the company's reduced investment in the segment and lower interest rates. Bad-debt expenses rose 19%. The allowance for doubtful accounts was flat sequentially at $1 billion.

Accounts at least 60 days behind rose to 5.8% of receivables from 4.5% a year earlier, and the 90-day delinquency rate rose to 4.1% from 3.1%.

Hmmm…here we find that revenues fell more than expected and that those same store sales, the most important measure of them all for retailers, fell 6.2% yr/yr.

Profits, on the other hand, were greatly helped by the fact that even though bad-debt expenses rose 19%, the allowance for doubtful accounts (which detracts from earnings) stayed flat at $1 billion (yikes!).

As a thought experiment, what if the allowance for doubtful accounts had increased by 19%, in line with the bad debt expense (at a minimum) as one would have expected? Then that would have resulted in a $190M charge to earnings, TGT would have reported earnings that were some 31% lower, and they would have missed their earnings target by more than 10 cents/shr. Fiddling with the doubtful accounts line is pretty much just a straight-up 101-level accounting shenanigan, and it really shouldn't fool anyone.

Because TGT held their doubtful accounts line steady, they were able to report better-than-expected earnings today, but will almost certainly have to report lower earnings in the future.

But the stock price is up today, and that is all that matters to TGT and Wall Street.

Okay, we're going to play the same game with Home Depot (HD), who also reported this morning. See if you can spot the game on your own:

Home Depot Profit Falls Less Than Analysts Estimated

Aug. 18 (Bloomberg) -- Home Depot Inc., the largest home- improvement retailer, reported second-quarter profit that fell less than analysts estimated and increased its full-year earnings forecast after reducing operating expenses.

Net income dropped 7.2 percent to $1.12 billion, or 66 cents a share, from $1.2 billion, or 71 cents, a year earlier, the Atlanta-based company said today in a statement. Excluding costs to close the company’s Expo business and a tax gain, earnings were about 64 cents a share. Analysts predicted 59 cents, the average of estimates compiled by Bloomberg.

Home Depot beat projections after rival Lowe’s Cos. yesterday reported profit and revenue that fell more than analysts anticipated. The companies are trying to counter sales declines with cost cutting as shoppers contend with sinking home values and job losses. Home Depot’s sales in the three months ended Aug. 2 decreased 9.1 percent to $19.1 billion.

“Home Depot’s ability to strongly manage inventory, and curb selling, general and administrative expenses, led to solid earnings performance that contrasts nicely with its peer’s results yesterday,” Joel Levington, an analyst at Hyperion Brookfield Asset Management Inc. in New York, said in an e-mail.

Digging a bit deeper into the financial reporting universe:

Quarterly results also included an approximately $50 million tax benefit related to a favorable foreign tax settlement. The tax benefited boosted earnings by about 3 cents per share.

Revenue dropped 9 percent to $19.07 billion from $21 billion, falling short of the $19.23 billion forecast of analysts polled.

Sales at stores open at least a year, known as same-store sales, slid 8.5 percent.

Same-store sales are a key indicator of retailer performance because they measure growth at existing stores rather than newly opened ones.

See the pattern? Promote the earnings, gloss over the revenue shortfalls, and ignore the accounting gimmicks.

Wash, rinse, repeat.

While I think that managing costs is a good thing for any business to do, it is not a sustainable path to earnings growth. Simply focusing on the bottom line results, as the mainstream press has done here, is ignoring important information about the true health and direction of TGT and HD.

August 2009 Unemployment Report

Investors have been anxiously awaiting the August unemployment report from the Bureau of Labor Statistics due this morning.

Here’s an excerpt from this morning’s Wall St. Journal:
____________________________________________________

SEPTEMBER 4, 2009, 8:46 A.M. ET

Job Losses Moderate, but Unemployment Rate Hits 9.7%

WASHINGTON -- U.S. job losses softened last month but the unemployment rate soared to its highest level since June 1983, proving that it will take some time for the ailing labor market to recover from the worst financial crisis in decades. Nonfarm payrolls declined 216,000 last month compared to a revised 276,000 drop in July, the Labor Department said Friday. The August drop is smaller than the 233,000 decline economists in a Dow Jones Newswires survey had expected.
____________________________________________________

So – the bottom line is that a 233,000 decline was ‘expected’ and job losses just beat this estimate – once again.

As always – we need to take a closer look at how this number was calculated and see if it makes sense.

From the U.S. Dept of Labor CES (Current Employment Statistics) birth/death model:


So – once again – we see that this ‘model’ added a significant number of jobs back into the total. What were total job losses without this model? Approximately 334,000 [I realize that the government's reported number is 'seasonally adjusted' - so we can't simply add these jobs back into the total - but the message here is that the reported number is being manipulated higher - without reason]. What do you think would happen to the markets if we reported a much worse than ‘expected’ job loss total (334K) coupled with an unemployment rate of 9.7%? I think it’s safe to say that stock markets will respond much more favorably to a total of 216.

If you’re not familiar with this model – it doesn’t measure the birth/death of people – it is supposed to account for the birth/death of businesses. Instead of using a quantitative number that can be verified – like payroll tax information (which is declining by significant amounts) – or ADP payroll gains/losses + actual government job gains/losses – our government uses a very confusing method for ‘calculating’ monthly job gains/losses. They use this model to guess how many businesses started and/or failed in a given month. How they do this – no one really knows. This is why many people are now noticing how ridiculous this model actually is – it has added a total of 1,029,000 jobs to the ‘official’ job reports since February. – during one of the worst recessions in decades. People expected the model to subtract jobs for August – based on all of the jobs added to the model since Feb – but no – it just keeps on adding jobs – which makes absolutely no sense in this current economic environment. The model added jobs to every sector in August – construction, manufacturing, mining, finance, services, hospitality, etc. Of course, very few people take the time to explore how the government reports unemployment numbers – so very few people know that this type of smoke and mirrors is going on. At some point, they won’t be able to disguise what’s happening – and you can guess what will happen once the truth gets out.

You might ask yourself – with all of the recent negative media articles related to all of these sectors – how could the government add jobs to each of them? Very good question. It would seem that the BLS modelers are not concerned with reality. It seems that they don’t even agree with other government agencies. Here’s a few I’ve seen over the past few days:

“The U.S. service sector contracted in August for the 11th straight month” (Service Sector) WSJ


“States shut down to save Cash” (including furloughs & lay-offs) WSJ


“Retailers reported that August sales declined 2.9%” (Service Sector) WSJ


“American Airlines lays off 1,200 flight attendants” AJC


“Shipping rates are sinking” (Baltic Dry Index declines 44% over the past 3 months) WSJ


“The [U.S.] service sector is crucial for the job market, accounting for nearly 86% of all nonfarm jobs in the U.S. – and it is still contracting, the ISM reported on Thursday” WSJ


“American Apparel will lay off more than a quarter of its factory workforce in Los Angeles……” WSJ


“Quiksilver profit drops 53% in tough retail environment” WSJ


“Boeing Co. said its commercial jet deliveries fell 22% in August from a year earlier and orders were down 11.5%.....” WSJ


“The long recession and rising joblessness are taking an increasing toll on the nation’s most credit-worthy borrowers, who are now falling behind on their mortgage and credit-card payments at a faster pace than people with poor financial histories.” WSJ


“Unemployment rates in 372 U.S. metropolitan areas continued their upward climb in July, Labor Department figures released Tuesday show. Some 19 metros now have unemployment rates above 15%...” WSJ


“Service-sector employment declined by 146,000 in August, while goods-producing jobs including construction and manufacturing fell by 152,000, according to Automatic Data Processing Inc., a payroll firm.” WSJ

Take note of this excerpt from an article in Thursday’s WSJ:

“The ADP report suggested "some downside risk" to the government's official August employment report, due Friday, but the ADP figure has been worse than the government's figure in six of the past eight months, according to economists at Goldman Sachs Group Inc. That is in part because ADP only tallies private-sector jobs. Government hiring has added about 2,000 jobs per month over the past year.” AJC

I would say that the ADP numbers are worse than the government’s unemployment numbers because the ADP numbers are based on reality.

If we calculate the unemployment rate the way it was calculated (total number of unemployed people who would work full time if they could find a job/total working age population) before all of this ‘modeling’ and ‘polling’ used to calculate current unemployment stats – what do we see?


We see a true unemployment rate of over 20%. I wonder what would happen if this was ever reported?

My guess is that if you are in a business that has direct contact with consumers – you are seeing (or are beginning to see) significant sales declines as unemployment continues to deteriorate.

You get the picture. This is just one more way the American people are being misled.

jg

Friday, September 15, 2006

The State of Joblessness

This article contains good information regarding what government should not do to balance a budget when revenues are falling.

Michigan is another canary in our economic coal mine. What is our federal government considering to close our historic budget deficits? Reduce the size of our bloated government? No. Significantly reduce federal spending? No. Reduce entitlements? No. Implement new taxes? Yes. We’re being led right off an economic cliff.

Although our leaders in Washington D.C. appear to be incompetent with regards to monetary/economic issues – they are not as inept as we’ve been led to believe. I cannot believe that they really think we can continue to run record deficits due to runaway spending – continually increase taxes to pay for this fiscal mismanagement – and not eventually suffer an economic calamity. The Federal Reserve has created this economic crisis – and now our political leaders are contributing to our demise.

This is a coordinated attack on the American people. It is a highly intelligent, very deceptive plan to lower our standard of living to the point that we will accept any new political/economic proposals – that offer us a return to ‘prosperity’.

Of course, as is always the case when you do a deal with the devil, there are a few things that are not being told to us. Our spiritual enemy will offer us a solution that will appear to be the right choice. What we won’t be told is that this choice will eventually result in our nation’s bondage.

jg – October 20, 2009
___________________________________
October 20, 2009

The State of Joblessness

The tragedy of Jennifer Granholm's Michigan.

Wall St. Journal (Opinion)

State lawmakers will soon face large budget deficits again, perhaps as much as $100 billion across the U.S. Here's some free budget-balancing advice: Steer clear of the Michigan model. The Wolverine state is once again set to run out of money, and it is once again poised to raise taxes even as jobs and businesses disappear.

In 2007 Governor Jennifer Granholm signed the biggest tax increase in Michigan history, with most of the $1.4 billion coming from business. The personal income tax—which hits nonincorporated small businesses—was raised to 4.2% from 3.95%, and the Michigan business tax levied a surcharge of 22%. The tax money was dedicated to the likes of education, public works, job retraining and corporate subsidies. Ms. Granholm and her union allies called these "investments," and the exercise was widely applauded as a prototype of "progressive" budgeting.

Some prototype. Every state has seen a big jump in joblessness since 2007, but with a 15.2% unemployment rate Michigan's jobs picture is by far the worst. Some 750,000 private-sector payroll jobs have vanished since the start of the decade. For every family that has moved into Michigan since 2007, two have sold their homes and left.

Meanwhile, the new business taxes didn't balance the budget. Instead, thanks to business closures and relocations, tax receipts are running nearly $1 billion below projections and the deficit has climbed back to $2.8 billion. As the Detroit News put it, Michigan businesses are continually asked "to pay more in taxes to erase a budget deficit that, despite their contributions, never goes away." And this is despite the flood of federal stimulus and auto bailout cash over the last year.

Following her 2007 misadventure, Ms. Granholm promised: "I'm not ever going to raise taxes again." That pledge lasted about 18 months. Now she wants $600 million more. Among the ideas under consideration: an income tax increase with a higher top rate, a sales tax on services, a freeze on the personal income tax exemption (which would be a stealth inflation tax on all Michigan families), a 3% surtax on doctors, and fees on bottled water and cigarettes. To their credit, Republicans who control the Michigan Senate are holding out for a repeal of the 22% business tax surcharge.

As for Ms. Granholm, she and House speaker Andy Dillon continue to bow to public-sector unions. There are now 637,000 public employees in Michigan compared to fewer than 500,000 workers left in manufacturing. Government is the largest employer in the state, but the number of taxpayers to support these government workers is shrinking. The budget deadline is November 1, and Ms. Granholm is holding out for tax increases rather than paring back state government.

The decline in auto sales has hurt Michigan more than other states, but the state's economy would have been better equipped to cope without Ms. Granholm's policy mix of higher taxes in order to spend more money on favored political and corporate interests. If any larger good can come of the experience, it is that Michigan is teaching other states how not to govern.

Printed in The Wall Street Journal, page A20

Consumer Spending Tumbles

We’re hearing a lot of people today tell us that the ‘great recession’ is either over – or will be ending soon. We’re hearing this from political leaders, financial leaders and economists. Many of these people are now pointing to the 3rd quarter increase in GDP (3.5%) released yesterday. As we discussed in yesterday’s post – no one should be celebrating this gain in GDP.

The problem – as we’ve seen time and again – is that very few people are analyzing the details behind the 3.5% gain - and are therefore blindly following the blind.

What is the real economy? Does the GDP number really give us a good indication of what is going on? I believe the answer is no. The real economy to ordinary people (that’s you and me) is employment, consumer & business spending, wages/income & our purchasing power (U.S. Dollar). I don’t know about you – but if I’m out of a job – I could care less what the government says about GDP (whether the actual number is accurate or not). If I don’t have a job – I’m not spending – I’m just trying to survive.

This is what 26 million of us are now doing – just trying to survive.


Because real unemployment is somewhere between 16-22% (depending on how you measure) – it should not surprise anyone that consumer spending is declining.

From the Wall St. Journal:

Spending Tumbles

Spending by Americans took a big tumble in September, as they lost a popular government subsidy and were left with a lousy job market and a credit crunch.

The 0.5% drop in spending was the largest since December 2008, when the recession was at its worst. Most of the drop was in durable goods, which include autos. Outlays on nondurable goods and services posted a gain from last month.

We’ve seen massive amounts of ‘stimulus’ money flowing into our financial system – but little of this is making its way to ordinary Americans. Since our monetary system is based on debt – let’s look at what banks are doing with their reserves.

Are they lending? No. Why? As I’ve said before – banks do not want to lend in this economic environment and as our economy continues to lose jobs – there will be fewer and fewer people and businesses who can qualify for loans.


Since we now know that bank loans directly contribute to our money supply – we would expect our money supply growth to slow considerably based on the charts above – and that’s exactly what we’re seeing.


Personal income is also flat or down.

With nearly 10% of the U.S. labor force out of work, incomes aren't going up much. September's flat reading followed a 0.1% August gain, revised from an originally reported 0.2% increase.

So – in the real economy where you and I get the money we need to survive – life is not good and the trends are not good. All of the people out there saying that the recession is ending are living in a fantasy land of government statistics and wishful ‘outlooks’.

For you and me – economic conditions continue to decline. As you’ve seen me say before – we’re rapidly approaching a cliff – and we’re going to be pushed off at some point.

Get ready for significant stock market declines in the near future. Economic fundamentals do not support current stock prices. When everyone wakes up to this economic reality – life in the stock market is going to be chaotic.

I have posted another good blog post by Karl Denninger below relating to the consumer spending report – followed by the Wall St. Journal article mentioned above.

jg – October 30, 2009
________________________________________

Friday, October 30. 2009

Posted by Karl Denninger in Macro Economics at 09:05

Another Bad Economic Report (PCI/Spend)

http://market-ticker.denninger.net/archives/1557-Another-Bad-Economic-Report-PCISpend.html

How do you get "economic recovery" out of these numbers?

Personal income decreased $0.1 billion, or less than 0.1 percent, and disposable personal income (DPI) decreased $0.2 billion, or less than 0.1 percent, in September, according to the Bureau of Economic Analysis. Personal consumption expenditures (PCE) decreased $47.2 billion, or 0.5 percent.

That looks like flat income and down spending to me.

Oh wait - we have to read past the first two sentences, right?

Let's do that.

Private wage and salary disbursements decreased $11.2 billion in September, in contrast to an increase of $10.1 billion in August. Goods-producing industries' payrolls decreased $7.8 billion, compared with a decrease of $6.3 billion; manufacturing payrolls decreased $1.5 billion, compared with a decrease of $4.1 billion. Services-producing industries' payrolls decreased $3.4 billion, in contrast to an increase of $16.4 billion.

Wait a minute. I thought that income was flat? We have a decrease, a decrease, a decrease and a decrease. How do we get to flat with those?

Supplements to wages and salaries increased $0.1 billion in September, compared with an increase of $2.0 billion in August.


Proprietors' income increased $0.7 billion in September, compared with an increase of $3.4 billion in August. Farm proprietors' income decreased $1.6 billion, compared with a decrease of $1.2 billion. Nonfarm proprietors' income increased $2.3 billion, compared with an increase of $4.6 billion.


Rental income of persons increased $5.4 billion in September, compared with an increase of $5.2 billion in August. Personal income receipts on assets (personal interest income plus personal dividend income) decreased $13.8 billion, the same decrease as in August. Personal current transfer receipts increased $17.3 billion in September, compared with an increase of $9.6 billion in August.

Ah.

Small business income was down compared to August, rental incomes were basically flat (compared to prior month), but income receipts on assets (dividends + interest on assets) decreased. Those are bad comps too.

The big Kahuna was government handouts, which was up big m/o/m. There's the entry that kept PCI and DPI from collapsing.

Real PCE -- PCE adjusted to remove price changes -- decreased 0.6 percent in September, in contrast to an increase of 1.0 percent in August.

Consumers are not spending.

All in all, another bad report. Not a disaster, but certainly not the stuff of which "economic recovery" is made.

The evidence continues to pile up......

_____________________________________
OCTOBER 30, 2009, 8:58 A.M. ET

Consumer Spending Tumbles

Wall St. Journal

by JEFF BATER

Spending by Americans took a big tumble in September, as they lost a popular government subsidy and were left with a lousy job market and a credit crunch.

The 0.5% drop in spending was the largest since December 2008, when the recession was at its worst. Most of the drop was in durable goods, which include autos. Outlays on nondurable goods and services posted a gain from last month. Spending rose 1.4% in August, revised up from a previously estimated 1.3% increase. That gain was driven by "cash for clunkers," which let motorists swap gas guzzlers for newer models. The car-rebate program started in July and ended in late August.

The subsidy helped push the economy to what the government reported this week was a 3.5% increase during the third quarter, seen as an end to the recession. But the recovery is expected to be slow, and questions abound to its sustainability once government stimuli fade. Another popular incentive, the first-time homebuyer tax credit, lapses in November, although the housing industry is trying to push an extension through Congress.

Commerce Department data Friday showed personal income flat compared to August while spending last month decreased by 0.5%. A key gauge of prices reiterated inflation wasn't an immediate threat, as the economy fights to recover.

Economists surveyed by Dow Jones Newswires had forecast income held steady during September and spending fell 0.5%.

With nearly 10% of the U.S. labor force out of work, incomes aren't going up much. September's flat reading followed a 0.1% August gain, revised from an originally reported 0.2% increase.

Personal saving as a percentage of disposable personal income was 3.3%, compared to 2.8% in August.

As for price gauges in Friday's report, the price index for personal consumption expenditures excluding food and energy, year over year, rose 1.3%. The year-over-year gain in August was also 1.3%. The Federal Reserve watches this core PCE index closely for signs of inflation pressures. Fed officials define their statutory goal of price stability as inflation of 1.5% to 2%.

On a monthly basis, the core PCE increased 0.1% in September compared to August. It has climbed at that rate five months in a row.

The PCE price index rose 0.1% in September compared to August. It rose 0.3% in August. Year over year, the PCE price index was down 0.5% in September. It fell at the same rate in August.

Write to Jeff Bater at jeff.bater@dowjones.com

Something is Coming - November 4, 2009

[email to family & friends]

It’s time to take your money off the table and go ultra-conservative. By ultra-conservative – I mean gold/silver and cash. At this point – leaving your money in anything else is tantamount to ‘letting it ride’, betting it all on black and rolling that little white ball – one more time.

Let me explain.

As you know, I’ve been watching financial markets closely over the past year. You also know that I believe we’re heading toward a significant economic decline based on the fact that our monetary system is unsustainable and what I see happening in the economy/markets today. Since I believe that we are very near some type of stock market ‘correction’, I have been closely watching markets for hints of anything out of the ordinary that could signal the next phase of this crisis.

I’m sending an email to you today because strange things have started happening. I have attached a couple of articles below from Chris Martenson that explains some of the market shifts we’re seeing – but he is certainly not the only one noticing. Many people are beginning to understand that markets are not behaving in a normal manner.

Before we get to Dr. Martenson’s blog posts – let me give you a few good reasons to get out of the market at this time.

1. Unemployment. For most of us, employment is the economy. Depending on how you measure unemployment – real unemployment in America is somewhere in the neighborhood of 16-22% if you count everyone who would work full-time if they could. Based on unemployment data released this morning for October – it appears that our economy lost another 200,000 jobs last month. Regardless of what economists & politicians tell us – no job recovery = no economic recovery. No economic recovery = no sales/revenue recovery for private/public companies.


2. Housing. Based on many mainstream media articles – it would appear that housing is rebounding somewhat. I believe that whatever positive news exists in the housing market is a direct result of the government’s $8K tax credit and artificially low mortgage rates (due to Federal Reserve actions). What happens when the tax credits expire and the Fed raises rates? The Federal Funds Rate will not hover near 0% forever. Based on our current Federal fiscal policies (massive budget deficits) – interest rates will rise dramatically at some point. What affect will this have on the stock market? Not good. We also should consider that many ‘option arm’ mortgages ($ billions) will reset in 2010 & 2011. I’ve read where the defaults on these exotic mortgages will be even worse than the sub-prime mortgage mess.


3. Commercial Real Estate. Two of the largest commercial real estate & small business lenders filed for bankruptcy last week (Capmark & CIT). This alone is very bad news for commercial real estate. With retail stores closing and retail/office vacancy rates increasing significantly – this isn’t going to turnaround quickly. When a billionaire real estate investor (Wilbur Ross) says that a ‘huge commercial real estate crash is beginning in the U.S.’ – it’s time to pay attention. With housing and commercial real estate in distress – bank failures will continue to accelerate. To date – 115 U.S. banks have failed since the beginning of the crisis. I’ve seen estimates that say anywhere from ‘hundreds’ to ‘thousands’ of banks are going to fail before this is over. Add in the fact that the FDIC insurance fund is effectively out of funds – and you have the beginning of a serious banking problem.


4. Dollar down – Gold up. We are watching the world’s confidence in fiat currencies slip considerably – and the U.S. dollar is leading this trend. Gold is no longer simply a hedge against inflation – it’s a hedge against the world’s fiat currency/monetary system. Gold hit its all time high this week and is approaching $1,100 an ounce. This is one of the recent market shifts – Gold has continued its march upward regardless of what is happening in other markets (currencies, stock/bond markets, etc.). This is the biggest indication that the world is losing confidence in our current monetary/economic system. If you’re worried about buying gold at a high – don’t be. $1,000 is going to look cheap – very soon.


                           U.S. Dollar Index


                            Gold

5. Over the past 7 months, we have watched the largest bear market rally in our history. After the crash of 1929 – there were many bear market rallies followed by significant declines. The DJIA did not recover to pre-1929 crash levels until the 1950’s. The current stock market rally dwarfs all of those rallies. Does a 30-50% stock market increase (depending on the index) really make sense - long term? Do corporate earnings support the increase in prices? Current Price to Earnings ratios are at all time highs. If you leave your money in the stock market – then you are betting that corporate earnings are going to increase significantly – and soon. History tells us one of two things will happen – prices are going to fall or earnings are going to rise. Based on the current state of our economy – you know what I believe is going to happen. I believe you’re looking at a bubble about to pop.


6. Corporate Insider Stock Selling is at all time highs. Corporate officers of publicly traded companies are selling their own stock (vs buying) at ratios of 30-40 to 1. This is an all-time record and it gives you good insight into what corporate officers believe is going to happen. Would they be selling at this magnitude if they believed their stock price was going to increase? Absolutely not. Do you think that you, your broker or your financial advisor has better information than the people running the largest companies in the world?

7. Large companies are hoarding cash. If everyone is confident in an economic rebound – why are so many companies increasing cash on their balance sheets? What does this say about their views regarding future sales/revenue and earnings?

From the Wall St. Journal (yesterday):

Jittery Companies Stash Cash
After Crisis, Big Businesses Hoard Most Bucks in 40 Years; Google's $22 Billion Cache

In the second quarter, the 500 largest nonfinancial U.S. firms, by total assets, held about $994 billion in cash and short-term investments, or 9.8% of their assets, according a Wall Street Journal analysis of corporate filings. That is up from $846 billion, or 7.9% of assets, a year earlier.


8. If you are monitoring 3rd quarter earnings reports – then you’ve noticed that sales/revenue declines continue for most large companies. While many companies have beaten their ‘expected’ earnings – we see that sales/revenue declines of 5-30% (YOY) continue. Many companies continue to reduce expenses to meet earnings expectations – but I see no top line sales/revenue rebound. Can earnings increase significantly over time without top line growth? What does this say about current stock price to earnings ratios? What does this say about future stock prices? Couple this with corporate insider trading (selling at all-time highs) and that companies are hoarding cash – and we begin to see what people who know are thinking.

9. Our monetary system will continue to crush our economy until we have nothing. Honestly – a couple of very simple charts tell us all we need to know (below). Our monetary system requires our debt to grow – forever. If our debt stops growing – and our money supply begins to decline – all kinds of bad things start happening (loan defaults, foreclosures, bankruptcies, etc.). This is what you are watching today. Everything that is collapsing around us is happening because of our current monetary system (Federal Reserve - Fractional Reserve Banking System).

The U.S. needs to create approximately $4 trillion dollars in debt this year – just to keep the music playing. We simply can’t do it anymore. Our incomes have not kept pace with our debt and inflation is destroying the purchasing power of the dollar. The game is over. Most of us haven’t realized this because there are much more important things going on – like fantasy football and American Idol. I wonder what Paris Hilton is up to today?

We’re playing our fiddles while Rome burns.


       (Source: chrismartenson.com)


      (Income Adjusted for Inflation)


10. You might ask - will our political and financial leaders do something before markets collapse? Let me ask you - do you see anything changing in Washington D.C.? We’re already borrowing over $1 trillion dollars this fiscal year to meet our current budget obligations – and our political leaders are trying to push through a new healthcare bill that will cost an additional $1 trillion dollars – as if the rules of finance do not apply to the Federal Government.

If you think that our political leaders have the knowledge and wisdom to prevent something catastrophic from happening – I think a quote from Joe Biden from earlier this year should sum up our expectations – ‘We must spend more money to prevent bankruptcy’. Enough said.

How about financial leaders? The Federal Reserve is promoting government stimulus programs while flooding the financial system with new money. Can we borrow our way out of this mess? Of course not. The U.S. Government is currently insolvent (liabilities far exceed assets) and heading straight down a path to cash-flow bankruptcy (unable to pay our debts as they come due). Printing massive amounts of new money will eventually destroy the value of the dollar – and we’re already seeing this trend today.

Bottom line – if you would like to place a bet that our current leaders will somehow solve this crisis before something catastrophic happens – I’ll take the bet and give you great odds.

If your 401(k) or IRA does not have a cash/precious metal investment option – you may be wondering about taking a penalty if you remove your cash.

Let me put it this way. Let’s say you got lucky in Vegas and doubled your money over a short period of time. The house then gave you two options. You can take 70% of your money (initial money plus winnings) off the table and give them 30% or you can put it all in play and let it ride again. What would you do? What do you think the house wants you to do? Our current situation is obviously not a game and there is much more at risk. Whether you realize it or not – you would have better odds in Vegas. The deck is stacked against us.

Don’t let pride and/or greed blind you from logic and reason. Don’t ignore the warning signs because you are trying to get all of your money back from last year’s market decline. It’s time to cash in our chips and go home.

My guess is that there are lots of brokers and financial advisors out there touting the recent market gains and telling people to continue to invest in stocks/bonds. If you have a broker/financial advisor saying these things – then you need to ask yourself a few questions. Does past performance have any bearing on tomorrow? The correct answer is no. How is your broker and/or financial advisor paid? Do they make money by selling more stocks and bonds? Do they lose money if you cash out stocks and bonds? Are they doing what’s best for you or only trying to make more money?

If you feel confident that your advisor passes these tests – then you have one final question to answer. Do you and your advisor understand our monetary system? Does your advisor know that our system requires exponential debt growth – forever? The quick way to know if someone understands the system is a very simple question – do you know how money is created in our system? If your advisor gives you a strange look and scratches his/her head – you have your answer. I say this because most people have no idea how the system really works – and even fewer have the analytical ability (or take the time) to understand the consequences of the system.

Well – that’s it. This is the last email you’ll receive from me on the financial system/crisis. I would really like to believe that markets will not decline significantly – but math doesn’t lie. Apples will always fall to the earth when dropped and exponential systems in a finite world will always fail when given enough time.

In theory, exponential systems continue on into infinity. In the real world exponential systems follow an exponential growth curve and then eventually suffer a catastrophic collapse. Theory has a funny way of failing when it bumps up against this thing called reality.

Chris Martenson used this example to explain the dangers of exponential growth:

Bacteria grow by doubling. One bacterium divides to become two, the two divide to become 4, become 8, 16 and so on. Suppose we had bacteria that doubled in number this way every minute. Suppose we put one of these bacterium into an empty bottle at eleven in the morning, and then observe that the bottle is full at twelve noon. There's our case of just ordinary steady growth, it has a doubling time of one minute, and it's in the finite environment of one bottle. I want to ask you three questions.

Number one; at which time was the bottle half full? Well, would you believe 11:59, one minute before 12, because they double in number every minute?

Second Question; if you were an average bacterium in that bottle at what time would you first realize that you were running out of space? Well, let's just look at the last minute in the bottle. At 12 noon it’s full, one minute before its half full, 2 minutes before its ¼ full, then 1/8th, then a 1/16th. Let me ask you, at 5 minutes before 12 when the bottle is only 3% full and is 97% open space just yearning for development, how many of you would realize there's a problem?

Exponential growth is sneaky. It doesn’t matter if you’re talking about bacteria or debt. One minute – everything’s fine. The next minute your world is collapsing. This is our world today. It’s 11:59 and we’re acting like everything is A-OK. If you want something else to keep you up at night – take a look at a graph of the world’s population growth over time. It’s the most important exponential graph in the world – affecting everything on a planetary scale (in the example above we’re the bacteria and the world is the bottle). Once again, we see something today climbing the steep incline of an exponential curve - but that’s a subject for another time.

When things eventually fall over the edge economically – there will be lots of people who will find out where they placed their faith. The most important of all questions you need to ask yourself now is – where is my faith? Who do I serve? Does my well-being rise and fall with the stock market? Does the world toss me around – or do I have a firm foundation for my life?

Most of the world has no idea what is coming. You are not one of these people.

Be Prepared.

John - November 4, 2009
_____________________________________

Market Shift - Something Is Coming

Sunday, November 1, 2009, 8:36 am, by cmartenson

Executive Summary

• A break in past relationships between the stock market, the dollar, and gold, along with a breakout in the VIX, could be signaling the beginning of an important turning point

• Capmark declares bankruptcy (CIT is next).

• A commercial real estate emergency is upon us.

• Is gold signaling a continuation of the financial crisis, or something more?

As you know, I spend a great deal of time combing the available market information for clues about what is happening in the economy and where it may be leading us. This past week (October 24 - October 31, 2009) showed some amazing developments indicating that a major turning point is once again upon us.

This assessment is based on several key events, including the bankruptcy of Capmark Financial, which kicked off the week, the return of volatility to the stock market (reminiscent of past tops), and the bizarre strength in the price of gold on Friday, even as the Dow peeled off nearly 250 points.

Let's take a look at these events one at a time...

Capmark Goes Belly Up

On Sunday, Capmark, one of the largest commercial real-estate lenders in the US, declared bankruptcy.

Capmark Seeks Chapter 11 (Wall Street Journal)

Capmark Financial Group Inc. has been one of the biggest lenders to U.S. investors and developers of office towers, strip malls, hotels and other commercial properties. An independent company that used to be the commercial lending unit of GMAC LLC, a financing affiliate of General Motors Co., it has been in financial straits for months and warned in September that it might have to file for Chapter 11 reorganization.

The filing comes amid similar troubles in the commercial-property arena. Mall-giant General Growth Properties and hotel-chain Extended Stay Inc. filed for bankruptcy in the past year, and more commercial-company real-estate ventures could fail, amid an inability to refinance debts and reduced customer traffic as consumers continue to pull back.

The difficulties are a blow to Capmark's private-equity owners. In 2006, a group led by Kohlberg Kravis Roberts & Co., Goldman Sachs Capital Partners and Five Mile Capital Partners paid $1.5 billion in cash to acquire lender GMAC's commercial real-estate business, which they renamed Capmark.

While the hundreds of billions in CRE loans that Capmark either made or serviced are now in jeopardy, the real problem here is that Capmark was up to its eyeballs in complex CRE derivative products:

The world changed this week (and most people have no idea).

I believe that the “temporary structural I-beam” that has supported our financial system for the past 8 months CRACKED on Sunday night with the bankruptcy of Capmark Financial. Capmark was THE ring leader in the Commercial Real Estate derivatives markets. Two days later GMAC declared they needed many more billions from the government. CIT will likely go down this weekend.

But the key to all this is that the Commercial Real Estate Derivative market is now IMPLODING. Everyone talks about the imploding Credit Default Swaps at AIG…which were bad but they are dwarfed by the derivatives related to Commercial Real Estate.

The Commercial Real Estate derivatives are the largest and most structured of all the derivative products. Just look at this 2007 presentation at a Mortgage Bankers Conference and you can see the insanity of these structured products.

http://www.mortgagebankers.org/files/Conferences/2007/CREFFebruary/DarrenEsser.pdf

For the curious, the linked PDF document in the above snippet provides a crystal-clear description of the mud that is a CRE derivative. If you can make any sense of that document, please call Fed right away, because they badly need to find someone who can.

While we wait for those complicated derivative products to blow up, and for Goldman Sachs to somehow make money on this badly failed investment of theirs, the more immediate issue is the more than $7 billion owed to unsecured creditors:

Capmark Files for Bankruptcy With $21 Billion in Debt

Capmark and its units owe $7.1 billion to the 30 largest creditors without collateral backing their claims, according to court documents.

The three biggest are Citibank NA, as administrative agent under the $5.5 billion credit agreement, with a claim of $4.6 billion; Deutsche Bank Trust Co. Americas, with claims of $1.2 billion and $637.5 million, respectively; and Wilmington Trust FSB with a claim of $500 million, according to court papers.

The bank with the largest exposure is Citi, possibly explaining their recent desperate move to jack up consumer credit card interest rates to 29.99%. Let's see...how has the stock of Citi been doing lately?


Not too well, as it turns out.

Also possibly connected to this is the news that GMAC is reportedly seeking an additional $5.6 billion from the US government.

GMAC seeks $5.6 billion more from government

The money that will probably go to GMAC raises another critical issue: what happens if financial institutions that have already received government funds need more money to continue operating or lending money to consumers and businesses? It is currently assumed that the largest banks like Citigroup and Bank of America are now on the mend and will be able to pay the government back the money that they have taken under TARP.

The driving forces behind this blow-up are not all that complicated to understand:

U.S. office vacancies are at a five-year high, apartment vacancies have hit a 23-year record, and retail centers are showing the greatest share of empty storefronts since 1992, according to real estate research firm Reis, Inc.

The US overbuilt commercial and retail space, and much of it is now sitting idle and burning cash at horrific rates. A recent trip to a mall in Holyoke, MA revealed a few empty storefronts and so few mall shoppers with bags of purchased goods that I actually felt out of place carrying mine.

One of the bigger and better investors in this arena recently said this about CRE:

Wilbur Ross Sees 'Huge' Commercial Real Estate Crash

Oct. 30 (Bloomberg) -- Billionaire investor Wilbur L. Ross Jr., said today the U.S. is in the beginning of a “huge crash in commercial real estate.”

“All of the components of real estate value are going in the wrong direction simultaneously,” said Ross, one of nine money managers participating in a government program to remove toxic assets from bank balance sheets. “Occupancy rates are going down. Rent rates are going down and the capitalization rate -- the return that investors are demanding to buy a property -- are going up.”

U.S. commercial property sales are forecast to fall to the lowest in almost two decades as the industry endures its worst slump since the savings and loan crisis of the early 1990s, according to property research firm Real Capital Analytics Inc. The Moody’s/REAL Commercial Property Price Indices already have fallen almost 41 percent since October 2007, Moody’s Investors Service said Oct. 19.

Ouch.

Given the size and complexity of the CRE market, the Federal Reserve, Treasury, and regulatory agencies will need to do some serious mopping up of this mess.

The problem is, the Fed is looking for ways to lighten its bloated balance sheet, not get in deeper right now. But I suspect that they will get in deeper. Not because they want to, but because they have to.

At any rate, I think that the Capmark situation was a key trigger event this week and that the ripples are just now lapping through the financial markets. One might think that we must be in a better position to handle such an event because we've been cleaning up the system for more than a year now. However, the reality is that there are more outstanding derivatives now than when we started. Even as the Fed and the Treasury were busy mopping things up over here, Wall Street was busy adding new risks over there.

Next up on my radar screen is CIT Group, which provides funding for small and medium-sized businesses. A freeze-up there would be catastrophic for tens of thousands of such businesses.


This company looks to be all but cooked at this point.

The size and scope of these disasters (Capmark and CIT), each of which would have individually rattled markets to their core just a few years ago, are now being shrugged off as "normal" - but they are not. These are extremely large, interconnected lynchpins of our overly-financialized economy.

A Change in Trend

In the markets this week, we saw some exceptional movements in the main stock indexes. The S&P 500 essential ground down all week from 1090 to 1040, losing 50 points by Thursday when the "miracle GDP report" was released, launching a 23-point gain.

This proved to be another sucker's rally; the next day, it gave up all of those 20 points, plus 7 more to boot.

Inquiring minds would like to know: Has the stock market topped? Was this all a bear market rally that has now ended?

One indicator I watch for signs that a change in trend is upon us is the so-called Volatility Index (VIX).

VIX Explanation

VIX is the ticker symbol for the Chicago Board Options Exchange Volatility Index, a popular measure of the implied volatility of S&P 500 index options. A high value corresponds to a more volatile market and therefore more costly options, which can be used to defray risk from this volatility by selling options. Often referred to as the fear index, it represents one measure of the market's expectation of volatility over the next 30 day period.

When the VIX is very low, there's a good chance of a market selloff, and when the VIX is high, there's a good chance for a market rally. When the VIX changes from low to high or vice versa, it is usually a pretty good mark of a change in trend.

Recently the VIX has been very low, and this week it broke out of its former down channel in a convincing fashion, leading me to wonder if a change in trend in stocks is finally upon us.


More qualitatively, volatility tends to mark market tops as opposing sides (belief systems) duke it out, often quite violently in the end. This was true in 2000 and 2007, and we may be seeing it here as well.

The breakout in the VIX certainly looks convincing. I will wait to see what Monday brings before making any moves. I am very close to reapplying my market shorts, which have been on the sidelines (in a bond fund) since January of 2009, but I will wait to see what sorts of rescues are attempted this week before going "all in."

The Strange Behavior of Gold

What really stuck out for me this week was that gold, which has been tracking the stock market practically tick-for-tick for months, recovered in the afternoon, even as the stock market remained pinned to the floor.

The red arrows and the blue arrows cover the same time periods in both charts (which are at slightly different scales):


This was an unusual turn of events and got me thinking that perhaps there is something lurking in the background…another financial breakdown, or an Israeli attack on Iran, or something.

I have found that keeping a close eye on the behavior of gold is one of the better 'early warning' indicators out there. While it doesn’t ever tell us what is happening, it does inform us that something is happening. It has been unusually reliable for me over the years, but one has to watch it closely.

What I mean by this is that looking at just the daily close would not give quite as much information as looking at the intraday behavior. It is highly unusual to see that the break-away occurred at 1:00 (on a Friday!), because it means that it happened right at the close of the London Physical bullion market for the weekend and because Friday post 1:00 is nearly always a sell off to the close (I don't know why, that's just an observation).

If we compare the S&P 500 to gold on a percentage chart (below), we see that they have recently been tracking each other tick-for-tick, and even percent-for-percent…until this week.

In particular, the largest percentage spread occurred on Friday of this week, with gold only losing $3 while the S&P 500 gave up 29.


For those keeping track at home, the price of gold has once again closed higher than the price of the S&P 500 ($1044 vs. 1036).

Of course, we could also look at gold compared to the dollar, specifically the USD index, as it has been trading in near-perfect opposition to the dollar for quite some time as well. In fact, stocks, commodities, and currencies have all been trading in a quite unnerving manner, with upticks in the dollar being associated with downticks in everything else. I cannot recall a time like this in all my years of watching the market, but I'd have to do an exhaustive data analysis to see if this observation is accurate.

Dollar up; stocks, commodities, and gold go down. And not just in the US either - but all over the globe, in near-perfect lockstep. It's almost as if the entire world's collective asset markets are trading as a single, gigantic blob. Like an enormous ocean liner without a single bulkhead. If the hull is ever pierced, the entire thing will sink.

In this next chart, we can see the relationship between gold and the dollar. If you trace each dotted line carefully you'll notice the near perfect "anti-dollar" behavior of gold (or is it the "anti-gold" behavior of the dollar?).

That last white candle for the dollar should have resulted in a pretty big sell-off for gold, but it did not. As I've already said, this is enough to make me sit up and begin watching everything with just a bit more vigilance and alertly scouring the weekend news.


Conclusion

Given the apparent lack of media concern over the bankruptcy of Capmark (beyond noting the facts), and given the odd strength of gold over this past week, my strongest suspicion is that we've got another financial crisis in the works. I believe that this is a ruined family weekend for many a Fed and Treasury staffer.

The stock prices of BAC, JPM, C, CIT, insurance companies, and other financial players are all signaling the same sorts of troubles I saw last spring before the big sell-off. While there always the possibility that another rescue will be engineered, we should be prepared for the possibility that one might not.

Speculating a bit, I think gold might be indicating that another Fed rescue is in the works, which will result in yet another round of dollar devaluation, as the world glumly concludes that the US is simply going to print its way out of every problem instead of taking its lumps.

Why the world has not already come to this conclusion is a great mystery.

I think that there is undoubtedly something brewing in the background, larger even than the nine bank failures announced this weekend. Something on the order of a renewed issue of insolvency for Citi, or perhaps a nasty derivative accident on the heels of the Capmark bankruptcy, is touching the core of the financial system.

The fact that the world's paper-asset markets are trading in such tight correlation (and have been for months) is additionally worrisome, because it means that an uncontained derivative accident will spread through all markets, leaving none untouched.

I strongly advise keeping a portion of your holdings in gold, in your physical possession, and always maintaining a sharp eye on your bank to assure that it is safe from entering FDIC receivership. While there have been no issues so far with any FDIC-insured accounts, I think that there is a strong possibility that we will see much greater difficulties going forward, including the possibility of actual losses (should a funding crisis develop).

My sense is that something is (again) seriously amiss. But as always, you should trust yourself and your own assessment of the situation above all else.

________________________________________

Severe Market Dislocation

Tuesday, November 3, 2009, 11:13 am, by cmartenson

This insider has been opened to allow for intra-day commentary on what is going on in the markets. As I see it there's something quite profound going on at the moment, I just don't know what it is yet.

As I wrote in the last Martenson Report, the behavior of gold was quite note-worthy as it ran counter to both the dollar and the stock market.

As of this writing, gold has suddenly vaulted to a new, all-time high even as the dollar remains in positive territory and the stock market is negative. Silver is following.

Here are the relevant charts.


That 60 cent move in silver over only 20 minutes is one for the books. I've not seen a move to the upside like that before, only the downside. Is it possible that stops work in both ways now in the metals markets? (note: that last sentence is said in jest...sort of...I've seen a lot of stop-clearing runs to the downside in silver over the years, this may be the first to the upside).

The Euro has broken down out of an intermediate uptrend channel (meaning it is weakening against the dollar) and this would ordinarily have resulted in an immediate gold (and silver) thumping. The stock market, inversely correlated with the dollar lately, is selling off as expected.

But not gold and silver. What gives?

Perhaps it's the emergence of a surprise buyer for half the IMF gold sales?

India buys half of IMF's gold for sale

MUMBAI/WASHINGTON, Nov 3 (Reuters) - The International Monetary Fund has sold 200 tonnes of gold to the Reserve Bank of India for $6.7 billion, quietly executing half of a long-planned bullion sale that has threatened to slow gold's ascent.

The deal, which surprised traders who expected China to be the most likely buyer, will relieve the gold market of some uncertainty over how and when the IMF would sell 403.3 tonnes of gold, about one-eighth of its total stock. The deal will increase India's gold holdings to the tenth largest among central banks.

Perhaps the movement in silver is related to the GATA report that several million ounces had been recently withdrawn from the Comex warehouses?

Perhaps there's another monetary/fiscal crisis in the works?

What are you seeing?